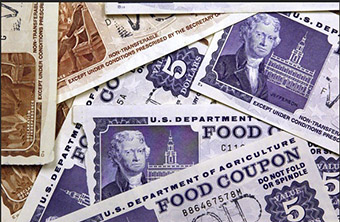
 The news that more Americans used food stamps to buy their Thanksgiving dinner this year than ever before has highlighted the utter failure of the current system—and the inevitability of its demise.
According to a non-profit government watchdog group The Sunlight Foundation, use of food stamps among low and no-income families has spiked since the collapse of the U.S. financial system four years ago—which was of course caused by the Jewish Supremacist predator banking system.
Figures released by the U.S. Department of Agriculture showed that average participation in the Supplemental Nutrition Assistance Program (SNAP), or food stamp program, has increased 70 per cent since 2007.
This Thanksgiving, about 42.2 million Americans used food stamps, according to the Economic Policy Institute. This is roughly the size of the populations of California and Connecticut combined.
The cost of the SNAP program last year reached $72 billion, the highest to date, according to the Congressional Budget Office.
Those costs are a source of major contention in Congress, which stalled on a bundle of legislation known as the farm bill this summer because it could not agree how much money should be spent on food stamps.
The farm bill, which directs the nation’s food policy, devotes about 80 per cent of its budget to the food stamp program.
As of March 2012, 46.4 million Americans were receiving on average $133.14 per month in food assistance. In Washington, D.C., and Mississippi, more than one-fifth of residents receive food assistance.
According to the United States Department of Agriculture (based on a study of data gathered in Fiscal Year 2010), statistics for the food stamp program are as follows:
* 49% of all participant households have children (17 or younger), and 55% of those are single-parent households.
* 15% of all participant households have elderly (age 60 or over) members.
* 20% of all participant households have non-elderly disabled members.
* The average gross monthly income per food stamp household is $731; the average net income is $336.
* 36% of participants are White, 22% are African-American, 10% are Hispanic, 2% are Asian, 4% are Native American, and 19% are of unknown race or ethnicity.


